
This number string attempts to do something a little different — it begins with the model (instead of the problem), and uses the model as an anchor to make sense of the context.
This means inviting students to “tell the story” to explain what is happening in the model. Then the story (and the model) expand, while the ratio stays the same. It is modified from ACE problems from the unit Comparing and Scaling (Connected Math Project, grade 7), and is intended to serve as a template for how existing curriculum can be used to design new flexible, interesting numeracy routines for students.
Here’s how you might start the conversation with kids…
In a minute, I’m going to show you a picture of situation and I want you to think about what is going on here and what you know to be true. Are you ready? Okay, here we go….
Let’s take 15 seconds to think — really think on your own — about what this model might be telling us. What do you think is going on here? What’s the story?
Now, turn and tell your partner what you think is going on here.
When you bring kids back together, you may hear things like:
- Someone is walking or running or biking
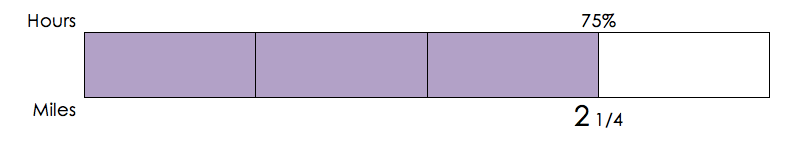
- It shows the relationship between hours and miles
- It shows a ratio between two quantities — hours and miles
- Whatever is happening, it is less than an hour because that would be 100% and this picture shows 75%
- 75% of an hour is 45 minutes (explore this and invite students to convince others that 75% of an hour is equivalent to 45 minutes)
Simply record each statement as it is named — helping kids by allowing them to both see and hear the ideas. Decide as a class whether these ideas could be true (don’t do that work for them). Once you have recorded a few true, or probably true, statements from the class, reveal a bit more information:
So, let’s imagine that this is a picture of our friend George’s daily walk. And let’s imagine that George goes on these walks every day in the late afternoons and that he walks as a constant or steady rate. What would that mean exactly — walking at a constant rate? Think about this for 30 seconds.
You may hear ideas here like the following:
- Steady or constant rate means that George never has to stop
- There is no traffic or interruptions or stoplights
- George doesn’t speed up or slow down
- I guess George is walking in the woods, not in the city
Okay, so let’s use this model to figure out some more things about George’s walk.
Write and say:
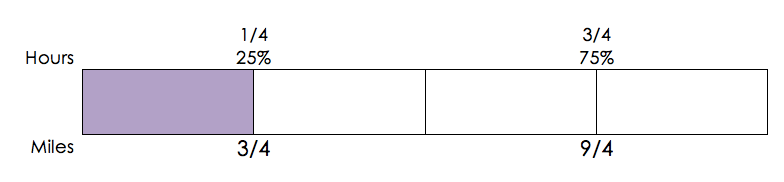
How far does George walk in 15 minutes?
Then, What would that look like in the model? Think for 15 seconds and then tell your partner how you are thinking about this one.
You will likely hear reasoning about how to use 45 minutes to find the 15 minutes (by dividing by three). The miles — 2 and 1/4 — are not as easily divisible by three, so a student may suggest that you rename them as 9/4 miles. You can represent that idea in the following bar model:
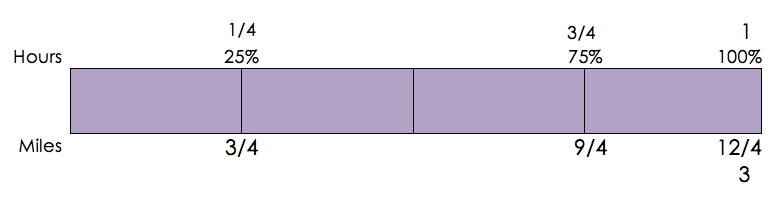
Okay, but often George tries to walk for a full hour. At this rate, how many miles is this? What is in the model to help us here?
A variety of strategies may emerge here (and that’s great):
- I added 1/4 of an hour (and 3/4 of a mile) and 3/4 of an hour (and 2 1/4 miles) to get a full hour, and 3 miles.
- I did it differently. I just kept adding 1/4 of an hour until I had an hour. So I added that part of the model four times and that meant adding 3/4 four times. In my head I did 3/4 + 3/4 + 3/4 + 3/4 which is 12/4 or just 3 miles.
- Yeah, mine was related to the last strategy but a little different. I took the piece we had (25% of an hour and 3/4 of a mile) and made it 4 times bigger. It went from 25% to 100% of an hour, and from 3/4 of a mile to 3 miles. I guess I multiplied by four instead of adding four times.
You can use the model or show students’ strategies on the model or just to the right or left of the model, or by gesturing so that kids can imagine the additive iteration of adding a “chunk” of the bar model (1/4 hours: 3/4 miles).
Be sure to check for understanding — Who thinks they understood this strategy and could say it in their own words? That might help us to hear it again in a different voice. This also gives students a chance to analyze another classmate’s strategy, which is, increasingly, an important part of what it means to do mathematics.
Keep going with the story:
So, how long would it take George to walk 4.5 miles. And how does this model support your thinking? Let’s think on this for a few seconds and then talk to our partners to verify our thinking.
There are lots of ways about getting to 4.5 miles on the model. You might here the following strategies:
- We knew that George could walk 3 miles in 1 hour, so from here I knew I needed 1.5 more miles, which is half of 3. So this made me think that 1.5 miles is half of 3 miles, so that part would take him just 1/2 of an hour. Then I added those two parts together, and I knew it would take him 1 and a half hours or 1.5 hours.
- I doubled the last one we found — 3 miles in 1 hour. I got 6 miles in 2 hours. That was too much, but I knew 4.5 is right in the middle of 3 and 6, so I think it is 1 and a half hours.
- Okay, so I tried to find a number that would go into 4.5 evenly. And I didn’t really see one. So I tried to find other parts of the model. When I found out that George could walk 1.5 miles in 1/2 of an hour, then I just used that and scaled it up (by three) to get 4.5 miles in 1.5 hours.

You can end the string in a variety of ways. Here are a few ideas:
How about this one — how long would it take George to walk 3 and 1/4 miles?
How long can George walk in 1/8 of an hour? By the way, how much time is that?
Using the model, can you make up a new combination of miles and hours that would be true, given George’s steady rate? Be ready to convince the class that it is true.
So, wait, if someone asked how fast George was walking, what would you tell them? How do you know? Is this faster or slower than you walk, do you think?
This last one might be modeled by simply identifying where the unit rate, or constant of proportionality (thanks, Morgan O’Brien), is most easily seen on the bar model. If the unit rate is about “one-ness,” where is the “one” and what “one” are we talking about here?

