Our 5th grade team was trying to address several challenges with implementing Common Core 5th grade standards of multiplying and dividing decimals and measurement conversions. Together with our Math in the City coach, Kara Imm, we created these strings.
The purpose of these strings is multi-faceted – we wanted these strings to do a lot, but seem easy and attainable to the students. First, we wanted to use a mathematical model that had the purpose of showing the relationship between multiplication and division, hence a ratio table. We did not want children to see a number, a unit of measure, then wrack their brains trying to decide whether or not to multiply or divide. The model would build habit, confidence, and reasonableness of answer.
Reasonableness of answer was a huge reinforcement of these strings. We felt if students could visualize a cm (say your pinky finger nail) then visualize a meter (arms length) that would push them away from getting stuck on what the conversion rule and help simplify and clarify what operation to preform.
Second, we needed to design the numbers to build off of their prior string work with multiplication and division – so you will see doubling and halving, numbers associated with money. Building upon this foundation of whole number multiplication and division would (hopefully) help us to alleviate some fears of operations with decimals. The ratio table also helped reinforce how to treat the decimal point when working between multiplication and division.
— Nicole Shields, Mariel Simon, Sybil Esenyan, Lori Krellenstein and Allie Minicone (5th grade teaching team, PS 158, Manhattan)
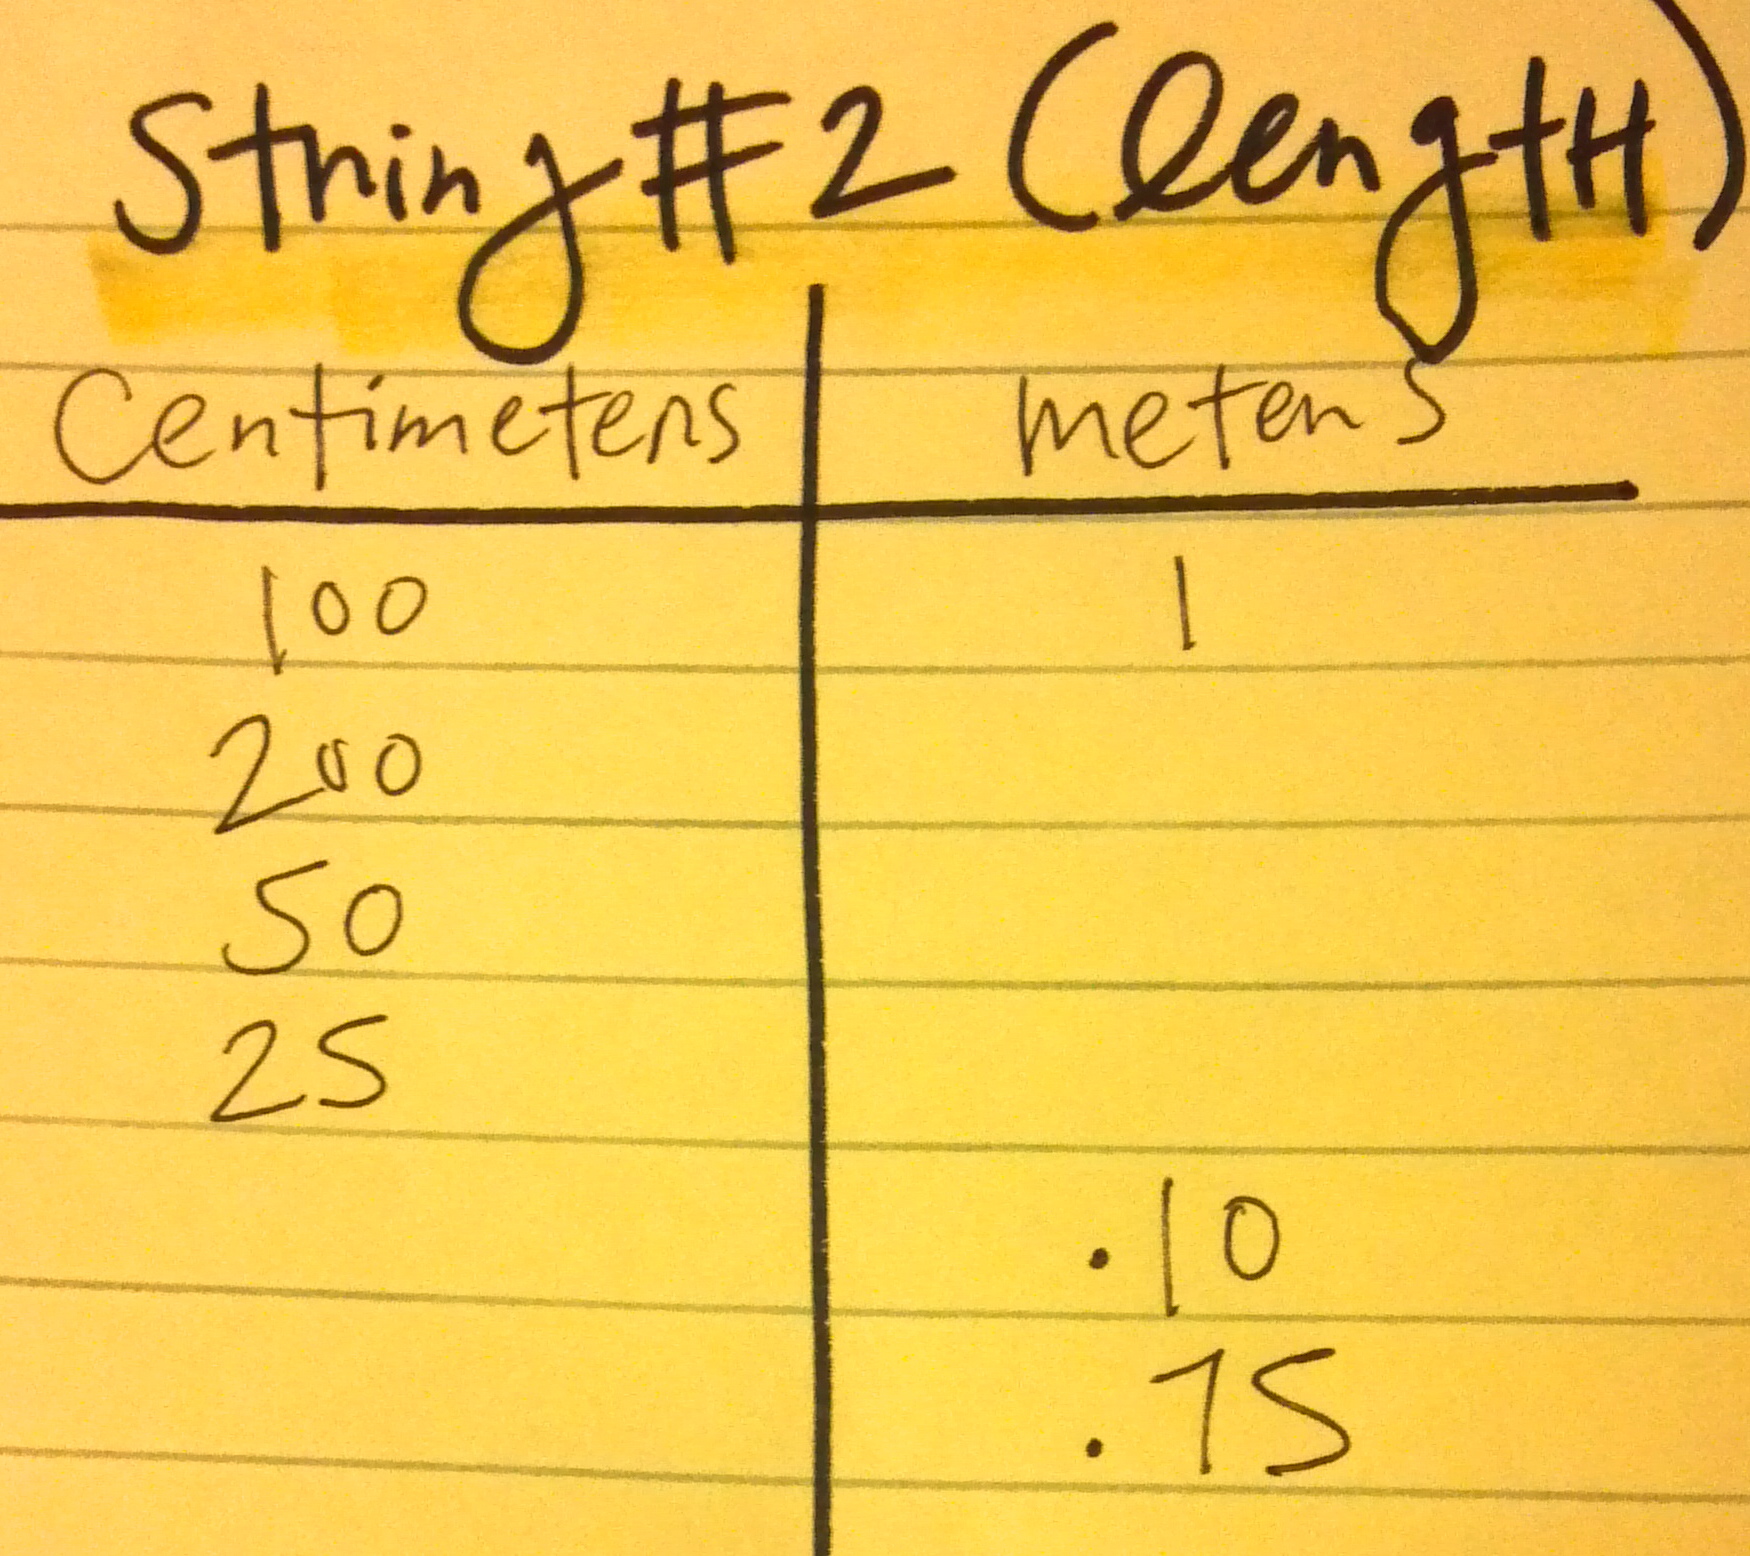
Tips for leading the string: In each case we started the conversation with kids by establishing the unit rate (first line of each ratio table). Then once we had some agreement there, we said, “So if it’s true that 100 centimeters is equivalent to 1 meter, what about 2 meters? Suppose I only was measuring 80 centimeters, now what?” We added values to the ratio table and slowly built the table, using the values here and children’s thinking to guide us. That is, we did not reveal the entire ratio table all at once. It emerged as the conversation did. In some cases we left the last line empty so that kids could make up a new true statement or we could pose a challenging one at the end.
Ultimately, we kept seeing conversion tasks for 5th graders and wanted kids to be able to solve problems like:
- How many 200 mL paper cups can be filled from a 2 liter jug of lemonade?
- I make 2.5kg of popcorn and eat 750g of it while watching a movie. How much popcorn is left?
We knew that having the ratio table as a tool to think with would be helpful.